![]()
Beautiful Plants For Your Interior

Kevin P. Josey, Ph.D., Scott W. Delaney, Sc.D., J.D., Xiao Wu, Ph.D., Rachel C. Nethery, Ph.D., Priyanka DeSouza, Ph.D., Danielle Braun, Ph.D., and Francesca Dominici, Ph.D.
Black Americans are exposed to higher annual levels of air pollution containing fine particulate matter (particles with an aerodynamic diameter of ≤2.5 μm [PM2.5]) than White Americans and may be more susceptible to its health effects. Low-income Americans may also be more susceptible to PM2.5 pollution than high-income Americans. Because information is lacking on exposure–response curves for PM2.5 exposure and mortality among marginalized subpopulations categorized according to both race and socioeconomic position, the Environmental Protection Agency lacks important evidence to inform its regulatory rulemaking for PM2.5 standards.
We analyzed 623 million person-years of Medicare data from 73 million persons 65 years of age or older from 2000 through 2016 to estimate associations between annual PM2.5 exposure and mortality in subpopulations defined simultaneously by racial identity (Black vs. White) and income level (Medicaid eligible vs. ineligible).
Lower PM2.5 exposure was associated with lower mortality in the full population, but marginalized subpopulations appeared to benefit more as PM2.5 levels decreased. For example, the hazard ratio associated with decreasing PM2.5 from 12 μg per cubic meter to 8 μg per cubic meter for the White higher-income subpopulation was 0.963 (95% confidence interval [CI], 0.955 to 0.970), whereas equivalent hazard ratios for marginalized subpopulations were lower: 0.931 (95% CI, 0.909 to 0.953) for the Black higher-income subpopulation, 0.940 (95% CI, 0.931 to 0.948) for the White low-income subpopulation, and 0.939 (95% CI, 0.921 to 0.957) for the Black low-income subpopulation.
Higher-income Black persons, low-income White persons, and low-income Black persons may benefit more from lower PM2.5 levels than higher-income White persons. These findings underscore the importance of considering racial identity and income together when assessing health inequities. (Funded by the National Institutes of Health and the Alfred P. Sloan Foundation.)
An extensive body of literature has concluded that exposure to air pollution containing fine particulate matter (particles with an aerodynamic diameter of ≤2.5 μm [PM2.5]) increases the risk of premature death.1,2 To protect the health of the public, the Environmental Protection Agency (EPA) promulgates National Ambient Air Quality Standards (NAAQS) for particulate matter, including PM2.5, and requires states to ensure that both short- and long-term PM2.5 concentrations fall below prescribed levels. The EPA sets the NAAQS on the basis of the best available scientific estimates of the health effects of PM2.5 exposure, taking into account uncertainties and ensuring an adequate margin of safety to protect the health of the public and that of sensitive populations.2,3 The current primary standard for annual (long-term) average PM2.5 levels, set in 2012, is 12 μg per cubic meter.3
Studies in the past several years have shown substantial adverse health effects at PM2.5 levels well below 12 μg per cubic meter.4-10 Effects may be larger among marginalized subpopulations that are disproportionately affected by PM2.5 pollution, including low-income and Black Americans.11-14 Consequently, no PM2.5 level may be low enough to fulfill the EPA mandates to “protect the public’s health” and “achieve environmental justice” by mitigating environmental health inequities.3,15,16 Nevertheless, lowering the PM2.5 NAAQS from its current level would generate substantial benefits for the health of our nation.15
However, currently available epidemiologic evidence is insufficient to effectively estimate the health benefits of lower PM2.5 NAAQS for three reasons. First, although some studies have assessed health effects of PM2.5 exposure among subpopulations defined by either racial and ethnic identity or socioeconomic position (e.g., income or education), none have considered effects among subpopulations defined by both. Doing so is important because structural racism and social exclusion can marginalize Americans in distinct ways.17,18 For example, associations between socioeconomic position and PM2.5-attributable mortality may (or may not) differ according to racial identity. Second, some previous studies have been conducted under the assumption that the exposure–response curve (i.e., the curve representing the risk of death at various PM2.5 levels) is linear, but the risk of death from increasing PM2.5 exposure may change at a nonlinear rate.7,8 Third, although some recent studies have implemented causal inference methods to estimate exposure–response curves, these methods are not widespread and have not been used to estimate exposure–response curves in marginalized subpopulations.6,19-21 Causal methods enable the estimation of nonlinear exposure–response curves and are less vulnerable to confounding and misspecification of the statistical model.2,6
To provide a more valid assessment of the projected risk of death that is avoided by lowering the NAAQS for annual average PM2.5, we analyzed data from more than 73 million Medicare enrollees from 2000 through 2016 linked with high-resolution PM2.5 exposure data and potential confounders. We estimated potentially nonlinear exposure–response curves for PM2.5 exposure and mortality for the full study population and for marginalized subpopulations defined according to intersections of racial and ethnic identity and socioeconomic position. We hypothesized that exposure–response curves would differ between subpopulations and that exposure–response slopes would be steeper among more marginalized subpopulations.
The study population included all Medicare beneficiaries 65 years of age or older enrolled from 2000 through 2016. Because all American citizens and many legal noncitizens are entitled to enroll in Medicare at the age of 65 years, our sample was nationally representative, and our findings are generalizable to the U.S. population 65 years of age or older (Table S1 in the Supplementary Appendix, available with the full text of this article at NEJM.org). In this open cohort, we used individual-level data from the Centers for Medicare and Medicaid Services (CMS) on age, sex, race or ethnic group, Medicaid eligibility, date of death, and residential ZIP Code. (Details are provided in Section S1 in the Supplementary Appendix.) The study protocol (available in the Supplementary Appendix at NEJM.org) was approved by the Harvard T.H. Chan School of Public Health institutional review board.
CMS obtains data about the racial and ethnic identities of beneficiaries primarily from the Social Security Administration, which collects beneficiary-reported racial and ethnic identity using a single variable instrument with seven mutually exclusive categories, including “Black,” “White,” and “Hispanic.” Because beneficiaries can select only one category, we assumed that Black- and White-identifying persons also identified as non-Hispanic. We focused our analyses on Black and White beneficiaries because, although all non-White racialized groups in the United States are marginalized in distinct ways, Black Americans comprise the second largest racial or ethnic group of Medicare beneficiaries and are uniquely burdened by structural racism.22-25 Separately, research on other racial and ethnic subpopulations enrolled in Medicare is complicated by substantial misclassification of other racial and ethnic identities in CMS data.26,27
We defined socioeconomic position on the basis of income. We defined “low income” persons as those eligible for any Medicaid benefits. Medicaid is a joint federal–state program providing additional health insurance to low-income and disabled Medicare beneficiaries (among others) with limited financial assets. We defined the remaining persons as “higher income,” which reflects only Medicaid ineligibility and does not imply high income levels.
We used estimates of PM2.5 exposure from a well-validated exposure prediction model that provides estimated daily PM2.5 levels at a 1-km2 grid scale across the contiguous United States.28 (Details are provided in Section S2 in the Supplementary Appendix.) We aggregated the gridded PM2.5 exposure data to ZIP Codes to match the spatial resolution of Medicare data. We averaged daily ZIP Code–level PM2.5 estimates across each year of the study to obtain annual average PM2.5 exposures.
We adjusted for study year, U.S. Census region, and 14 area-level sociodemographic, meteorologic, and health-behavior variables. We mapped all census tract and county-level variables to the ZIP Code level. These variables have been used extensively in Medicare-based studies of PM2.5 and mortality (see Section S3 in the Supplementary Appendix).
We calculated stratum-specific mortality data, with strata defined jointly according to age, sex, race, Medicaid eligibility, and follow-up year. To link mortality data with PM2.5 exposure data, we aggregated stratum-specific mortality data to the ZIP Code level to create ZIP Code–specific and stratum-specific numbers and rates of death (see Section S4 in the Supplementary Appendix).
We tailored an established causal inference method for continuous exposures to estimate exposure–response curves using stratum-specific mortality data adjusted for 16 confounders.21,29 The method incorporates an outcome model and an estimated inverse probability of exposure weight to adjust for confounding, which produces a doubly robust estimator.30 If either the outcome model or the inverse probability of exposure weight is well approximated, then the exposure–response curve estimator is consistent, which makes the estimated curve more robust to model misspecification and reveals evidence of a link under certain assumptions.30 We applied this method to estimate exposure–response curves, hazard ratios, and 95% confidence intervals for the full Medicare population and for race-by-income subpopulations. We did not adjust confidence intervals for multiplicity; thus, they should not be used in place of hypothesis testing.
We conducted sensitivity analyses using other methods (see Section S5 in the Supplementary Appendix). All analyses were done at the ZIP Code level, but we describe subpopulation results with respect to “persons” for clarity. All code is on GitHub at https://github.com/kevjosey/pm-risk. opens in new tab (analyses) and https://github.com/NSAPH/National-Causal-Analysis. opens in new tab (data processing).
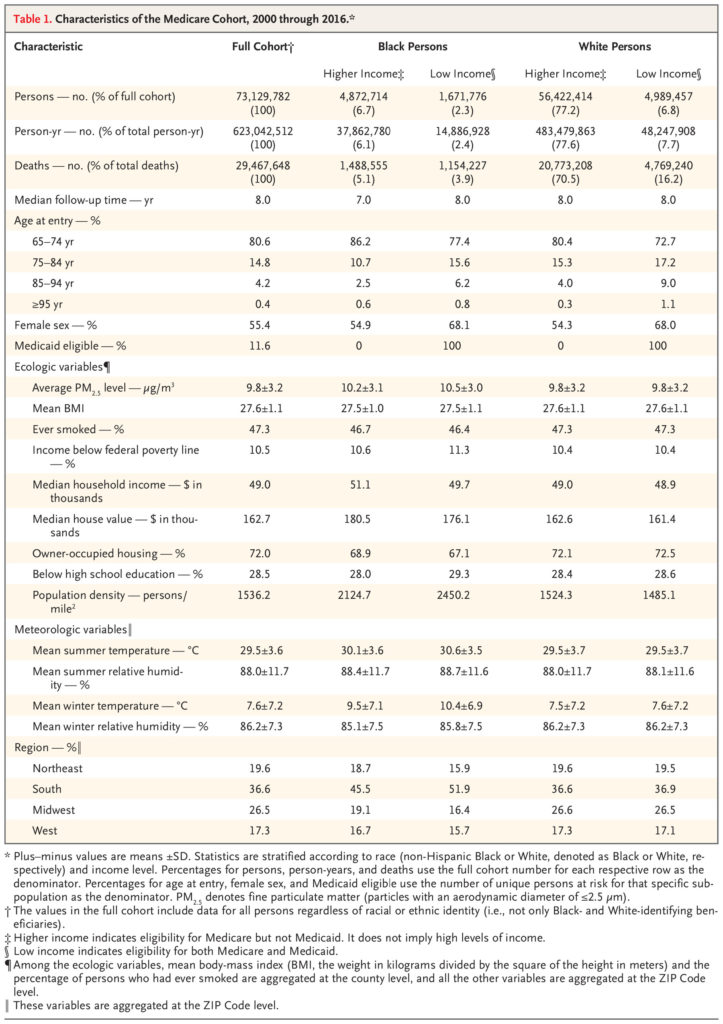
The full study population included 73,129,782 beneficiaries and 623,042,512 person-years of data from 2000 through 2016 (Table 1). The mean (±SD) average annual PM2.5 exposure during the study period was 9.8±3.2 μg per cubic meter across the full population, although levels decreased over time. White persons were exposed to lower PM2.5 levels than Black persons. Among Black persons but not White persons, higher-income persons were exposed to lower PM2.5 levels than low-income persons. Overall, racial identity, not income, was the primary sociodemographic characteristic distinguishing PM2.5 exposure levels among the subpopulations we analyzed (Figure 1).
Table 1. Characteristics of the Medicare Cohort, 2000 through 2016.
Lowering PM2.5 exposure along the continuum from 12 μg per cubic meter to 6 μg per cubic meter was associated with a decreased hazard ratio for death (Figure 2). As compared with an annual average PM2.5 exposure of 12 μg per cubic meter (the current NAAQS, used as the reference level), exposure to 8 μg per cubic meter (as one possible alternative NAAQS) was associated with a hazard ratio of 0.958 (95% confidence interval [CI], 0.951 to 0.965). The exposure–response curve between 6 and 12 μg per cubic meter appeared approximately linear.
Figure 2. Exposure–Response Curve for PM2.5 Exposure and Mortality among the Full Medicare Population.
![Figure 1. PM2.5 Exposure during the Study Period.
Shown is the annual average exposure to fine particulate matter (particles with an aerodynamic diameter of ≤2.5 μm per cubic meter [PM2.5]) for Black higher-income persons (blue solid line), Black low-income persons (blue dashed line), White higher-income persons (orange solid line), and White low-income persons (orange dashed line) from 2000 through 2016. The orange dashed and solid lines overlap substantially, which indicates that the White higher-income and low-income persons were exposed to similar levels of PM2.5 pollution. The inset shows the same data on an enlarged y axis.](https://a-bantu.org/wp-content/uploads/2023/05/nejmsa2300523_f1-1024x972.jpg)
Shown is the annual average exposure to fine particulate matter (particles with an aerodynamic diameter of ≤2.5 μm per cubic meter [PM2.5]) for Black higher-income persons (blue solid line), Black low-income persons (blue dashed line), White higher-income persons (orange solid line), and White low-income persons (orange dashed line) from 2000 through 2016. The orange dashed and solid lines overlap substantially, which indicates that the White higher-income and low-income persons were exposed to similar levels of PM2.5 pollution. The inset shows the same data on an enlarged y axis.
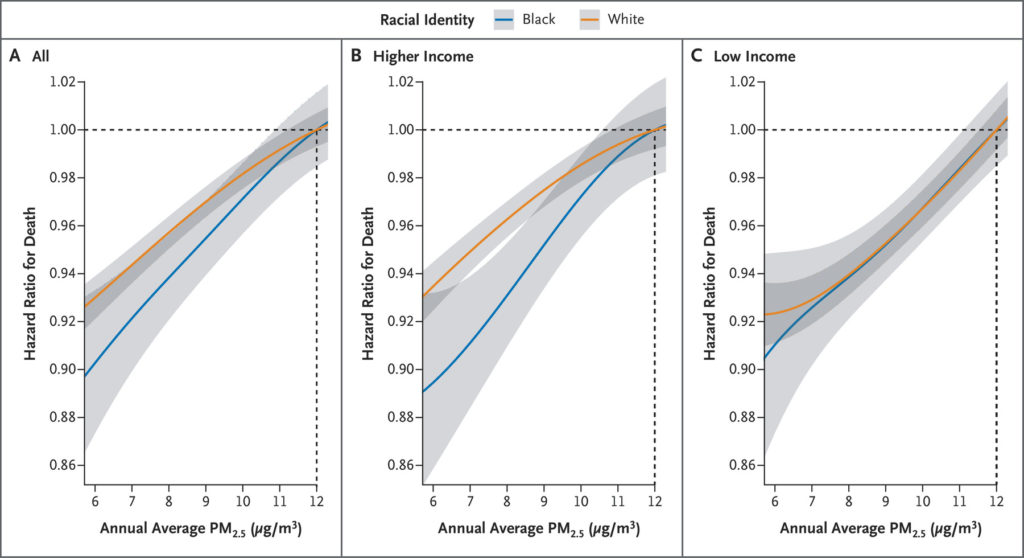
Exposure–response curves differed between some subpopulations. For example, estimates of the hazard ratio for death dropped faster for Black persons than for White persons as the annual average PM2.5 exposure decreased (Figure 3A), although the confidence intervals of the two curves overlapped. Among higher-income beneficiaries (Figure 3B), the exposure–response slope was steeper for Black persons than for White persons. Lowering exposure from 12 μg per cubic meter to 8 μg per cubic meter was associated with a hazard ratio of 0.931 (95% CI, 0.909 to 0.953) for Black higher-income persons and 0.963 (95% CI, 0.955 to 0.970) for White higher-income persons (Figure 4). Put differently, among higher-income persons, the decrease in mortality (1−hazard ratio [HR]) that was associated with a decrease from 12 μg per cubic meter to 8 μg per cubic meter was nearly double for Black persons as compared with White persons: 1−HRBlack higher-income=0.069 (95% CI, 0.047 to 0.091) and 1−HRWhite higher-income=0.037 (95% CI, 0.030 to 0.045)
Figure 3. Exposure–Response Curves for PM2.5 Exposure and Mortality among Marginalized Sub-populations.
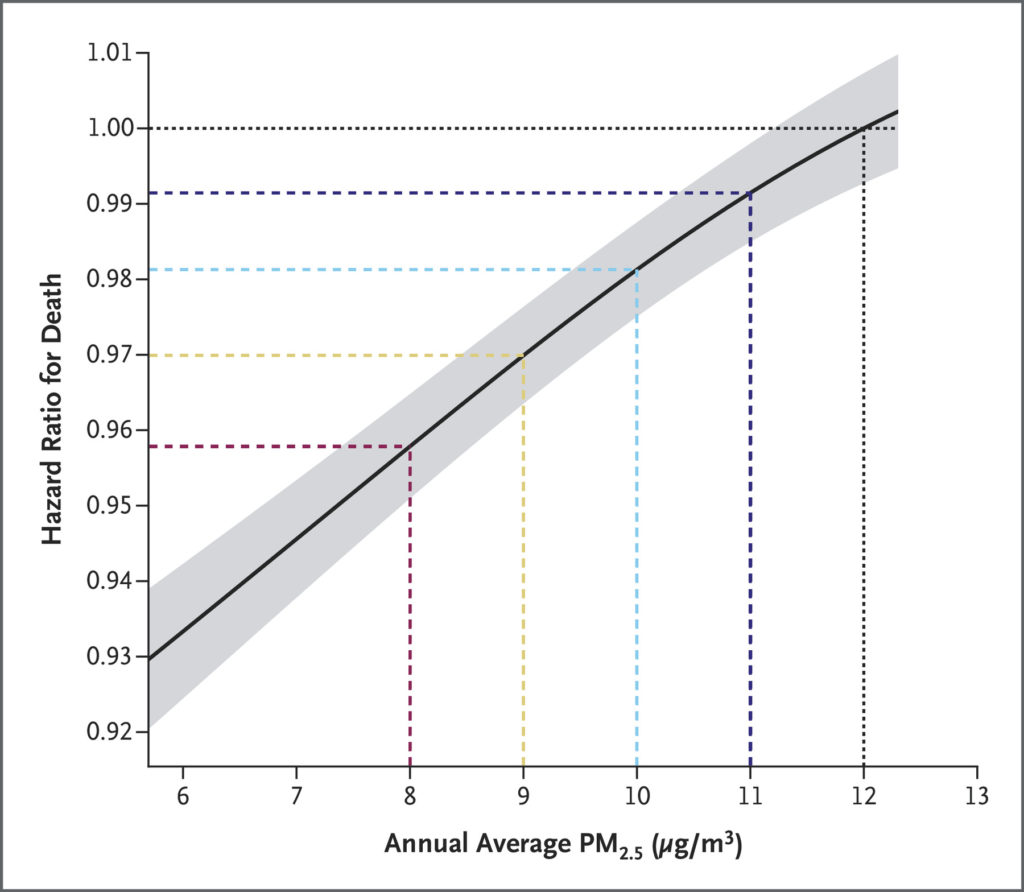
Shown are the point estimate (solid line) and 95% confidence interval (gray shaded area) of the hazard ratio for death corresponding to decreases in annual average PM2.5 exposure (to 6 to 11 μg per cubic meter) with respect to 12 μg per cubic meter on average for the full population. Estimates below 6 μg per cubic meter are not shown in order to focus attention on plausible ranges for PM2.5 pollution policy. Confidence intervals were not adjusted for multiplicity; therefore, they should not be used in place of hypothesis testing.
In contrast, exposure–response curves for both Black low-income persons and White low-income persons appeared mostly linear and nearly identical between 6 and 12 μg per cubic meter. For example, the hazard ratio associated with a decrease from 12 μg per cubic meter to 8 μg per cubic meter was 0.940 (95% CI, 0.931 to 0.948) for White low-income persons and 0.939 (95% CI, 0.921 to 0.957) for Black low-income persons. Results from sensitivity analyses showed consistent patterns. Point estimates from all three alternative modeling strategies suggested that exposure–response curves were steeper for Black persons than for White persons (regardless of income) and for Black higher-income persons than for White higher-income persons. Sensitivity estimates for low-income exposure–response curves were less stable, but all models suggested similar overall patterns (Figs. S2 and S3).
Figure 4. Differences in Mortality with Decreasing PM2.5 Exposure among Marginalized Subpopulations.
Shown are point estimates and 95% confidence intervals of the hazard ratio for death comparing different levels of annual average PM2.5 exposure (12 μg per cubic meter vs. 11, 10, 9, or 8 μg per cubic meter) on average for subpopulations defined in selected ways. Low income was defined as dual eligibility for both Medicare and Medicaid. Confidence intervals were not adjusted for multiplicity; therefore, they should not be used in place of hypothesis testing.
Discussion
Our findings provide strong evidence that lower PM2.5 levels — and thus lower PM2.5 NAAQS — would benefit all aging Americans, regardless of racial identity or socioeconomic position. Moreover, we found that racial identity and socioeconomic position may combine to alter exposure–response curves for long-term PM2.5 exposure and mortality and that Black higher-income, Black low-income, and White low-income persons may benefit more from a lower PM2.5 NAAQS than White higher-income persons. Together, our results suggest that a lower PM2.5 NAAQS may reduce environmental inequities among a broad swath of Americans marginalized by structural racism and social exclusion and disproportionately affected by air pollution.
Our study builds on previous research that estimated the health effects of long-term PM2.5 exposure among Medicare beneficiaries, which includes studies assuming both linear and nonlinear exposure–response curves.6,7,9,10,13,19-21 In a previous report, we used causal and more traditional methods to estimate linear exposure–response curves for PM2.5 exposure and mortality for the full Medicare population. Across five statistical approaches, we found that for every increase of 10 μg per cubic meter in annual PM2.5, the increase in estimated hazard ratio for death ranged from 1.062 (95% CI, 1.055 to 1.069) to 1.076 (95% CI, 1.065 to 1.088).7 In contrast, when we extrapolate the estimates from the present study of the relative risk of death between 8 and 12 μg per cubic meter in the full population, the hazard ratio for death per increase of 10 μg per cubic meter in annual PM2.5 was 1.114 (95% CI, 1.094 to 1.134). Thus, this study suggests a somewhat higher hazard ratio associated with increasing PM2.5 than our previous estimates within an exposure range relevant to current policy.
However, our current study is not directly comparable to those previous efforts because we used a distinct approach to enable estimation of subpopulation exposure–response curves with the goal of more directly informing policy. We tailored established causal inference methods to enable doubly robust, subpopulation-specific estimates of potentially nonlinear exposure–response curves. We improved these methods for use with our nationally representative sample of 623 million person-years, which maximized our statistical power for analyses of narrowly defined subpopulations, and ensured covariate balance and robustness to model misspecification. Results of three sensitivity analyses that used different approaches to adjust for confounding yielded similar results.
Structural racism and social exclusion of low-income Americans are associated with inequities in both exposure and susceptibility to PM2.5. For example, exposure inequities caused by “disparate siting,” in which roadways and pollution-emitting facilities are disproportionately built in Black or low-income communities (among other marginalized groups), are well documented and observed in both urban and rural areas.12,31,32 Consequently, although Black Americans produce proportionally less air pollution than White Americans, they breathe more of it.33 Our finding of differences in PM2.5 exposure according to income among Black Americans but not White Americans suggests that race (and thus structural racism) is more salient than income in driving inequities in PM2.5 exposure.
The greater susceptibility to PM2.5 pollution that we found among marginalized subpopulations is attributable to social structural forces, rather than innate biologic differences.26 For example, as compared with White or higher-income Americans, both Black and low-income Americans are burdened by poorer health care and housing and have fewer PM2.5-buffering resources (e.g., access to health-promoting greenspace).23,24,34 Black Americans also face interpersonal discrimination, which can further harm health.35 Whether and how these factors combine to alter PM2.5 susceptibility may depend on both race and social class. We found that the slope of the exposure–response curve for PM2.5 exposure and mortality was steeper for Black than for White beneficiaries among those with higher incomes but not among low-income beneficiaries.
This study has limitations. First, residential address data, which we used to measure exposure and several covariates, are available at the ZIP Code level, but we used individual-level data for some other covariates (e.g., age, sex, race, and Medicaid eligibility). To accommodate the hybrid nature of our data, we calculated stratum-specific numbers and rates of death (stratified according to individual-level age, sex, race, Medicaid eligibility, and follow-up year) to adjust for individual-level covariates, then we added area-level covariates to adjust for confounding. In previous work that used a similar set of area-level covariates, we found that additionally adjusting models for a more extensive set of individual-level covariates (e.g., smoking history) did not meaningfully alter results.6,13,36 Second, although we used a well-validated PM2.5 model to assign exposures, the model includes some error.28 Nonetheless, previous research suggests this PM2.5 exposure error does not meaningfully affect estimates of the relationship between PM2.5 exposure and mortality.21,37,38 Third, CMS data on race or ethnic identity misclassifies some persons and does not reflect the complexity of racial and ethnic identity in the United States, and this misclassification may result in bias.26,39 Fourth, although we used methods for causal inference, our results may still be biased from unmeasured confounders.
Our findings are directly relevant to current EPA regulatory decision making. On January 27, 2023, the EPA announced a proposal to lower the annual PM2.5 NAAQS from 12 μg per cubic meter to between 9 and 10 μg per cubic meter, although it is considering standards anywhere between 8 and 11 μg per cubic meter.40 To develop its proposal, the EPA conducted a Policy Assessment to evaluate whether the current standard adequately protects the health of the public and a Regulatory Impact Analysis (RIA) to estimate the benefits of NAAQS alternatives.3,15 For both analyses, the EPA considered differences between Black persons and White persons in susceptibility to PM2.5 pollution.
Our study augments the EPA analyses in multiple ways. For example, as compared with the RIA, which based some estimates of the effects of PM2.5 on mortality in the full population on a hazard ratio derived with the use of noncausal methods,7,15 our analysis that used doubly robust methods yielded a hazard ratio for death per increase of 10 ug per cubic meter in annual PM2.5 that was 45% larger (hazard ratio, 1.066 [95% CI, 1.058 to 1.074] in the EPA RIA vs. 1.114 [95% CI, 1.094 to 1.134] in our study). This finding implies that the EPA impact analysis may underestimate the health benefits of stronger NAAQS policies. In addition, the RIA based its race-specific hazard ratios on analyses that did not assess the combined effects of racial identity and socioeconomic position13,15 and did not consider income-based differences in PM2.5 susceptibility at all.
Our study findings suggest that a comparatively lower annual PM2.5 NAAQS will lead to larger reductions in mortality among older Americans and produce greater health benefits among a wider array of disproportionately affected Americans than previously recognized. Our results also imply the inverse — namely, that a relatively higher PM2.5 NAAQS will continue to place all Americans, and particularly marginalized Americans, at higher risk for PM2.5-attributable death. Consequently, the EPA public health and environmental justice–seeking mandates may require considerably stronger NAAQS for annual PM2.5 (e.g., ≤8 μg per cubic meter).
Supported by the National Institutes of Health and the Alfred P. Sloan Foundation.
Disclosure forms as provided by the authors are available with the full text of this article at NEJM.org.
Drs. Josey and Delaney and Drs. Braun and Dominici contributed equally to this article.
This article was published on March 24, 2023, at NEJM.org.
A data sharing statement provided by the authors is available with the full text of this article at NEJM.org.
From the Departments of Biostatistics (K.P.J., R.C.N., D.B., F.D.) and Environmental Health (S.W.D.), Harvard T.H. Chan School of Public Health, Boston; the Department of Biostatistics, Mailman School of Public Health, Columbia University, New York (X.W.); and the Department of Urban and Regional Planning, University of Colorado Denver, Denver (P.D.).
Dr. Dominici can be reached at fdominic@hsph.harvard.edu or at the Department of Biostatistics, Harvard T.H. Chan School of Public Health, 655 Huntington Ave., Bldg. 2, 4th Flr., Boston, MA 02115.
| Supplementary Appendix | 344KB | |
| Disclosure Forms | 681KB | |
| Data Sharing Statement | 75KB |